|
Name |
line()线段 |
||||||||||||||||||
|
Examples |
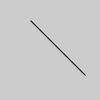
line(30, 20, 85, 75);
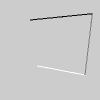
line(30, 20, 85, 20); stroke(126); line(85, 20, 85, 75); stroke(255); line(85, 75, 30, 75);
// Drawing lines in 3D requires P3D // as a parameter to size() size(100, 100, P3D); line(30, 20, 0, 85, 20, 15); stroke(126); line(85, 20, 15, 85, 75, 0); stroke(255); line(85, 75, 0, 30, 75, -50); |
||||||||||||||||||
|
Description |
Draws a line (a direct path between two points) to the screen. The version of line() with four parameters draws the line in 2D. To color a line, use the stroke() function. A line cannot be filled, therefore the fill() function will not affect the color of a line. 2D lines are drawn with a width of one pixel by default, but this can be changed with the strokeWeight() function. The version with six parameters allows the line to be placed anywhere within XYZ space. Drawing this shape in 3D with the z parameter requires the P3D parameter in combination with size() as shown in the above example. 在屏幕上绘制一条直线 (两点之间的直接路径)。具有四参数的行 () 的版本在2D 中绘制该行。若要对线条着色, 请使用描边 () 函数。无法填充线条, 因此填充 () 函数不会影响线条的颜色。默认情况下, 2D 线条以一个像素的宽度绘制, 但这可以用 strokeWeight () 函数来更改。带有六参数的版本允许将该行放置在 xyz 空间中的任何位置。使用 z 参数在3D 中绘制此形状要求 P3D 参数与大小 () 结合使用, 如上例所示。 |
||||||||||||||||||
|
Syntax |
line(x1, y1, x2, y2) line(x1, y1, z1, x2, y2, z2) |
||||||||||||||||||
|
Parameters |
|
||||||||||||||||||
|
Returns |
void |
||||||||||||||||||
|
Related |
strokeWeight() |
- 本文固定链接: http://iprocessing.cn/2017/07/28/line线段/
- 转载请注明: 卡萨布兰卡 于 Processing编程艺术 发表


